
Use case: Soybean crush trading in Arantys (In English)
Recently Cadran Consultancy has developed a use case for soybean crush trading functionality in Arantys. We have recently published a blog on the use of characteristics of Soy within Arantys, now we have extended this with a broader use case. Using existing trading, logistics and finance functionality, the system supports the crush spread trading and the physical supply and manufacturing. By providing an integrated system, the full process can be tracked and further optimized. This use case was developed to create more awareness and insight into the possibilities of our solution for the soy market and shows the flexibility of the system and its applications. From skimmed milk powder to soybean crush: Arantys provides an integrated overview that is relevant to many different commodities and applications. In this use case you will see integrations between trading use cases and manufacturing and logistical processes. Also the use of an integrated data model with self-service BI is made visible.
Soybean crush and Crush Spread
Soybeans are processed into soybean meal and soybean oil through a process known as crushing. The crush spread is the difference between the value of soybeans and its by-products and is considered a gauge of the potential profit margin for soybean processors. Maintaining an accurate overview of the balance and therefore the profit margin is crucial. This allows for an optimal production planning, whilst maintaining a profitable trading business.
In a crush spread, the trader takes a long position in Soybean futures against short positions in Soybean Meal and Soybean Oil futures. This is also known as the board crush. The value of the crush equals the Soybean Oil futures price plus the Soybean Meal futures price, minus the price of Soybean futures. Soybeans, soybean meal and soybean oil all trade in different units:
Soybeans, soybean meal and soybean oil all trade in different units:
- Soybeans trade-in bushels
- Soybean Meal trades in short tons
- Soybean Oil trades in pounds
So in order to perform an accurate calculation and position management, the prices of the three commodities need to be converted to a common unit. Arantys supports this and allows for analysis across different units of measure across the supply chain. Cost impact, pricing impact and visibility of these different units of measure across the supply chain is maintained by Arantys. For a trader however it’s important to be able to have this overview and being able to handle this complexity, without being bothered by it. Therefore we have created a user interface with overviews which allows the end user to focus on these key tasks.
Dashboards
To support the trading and the logistics processes Cadran has developed dashboards so that traders and logistics employees can have a clear overview of their main processes and be able to act on information and alerts that are provided on these dashboards.
Trading
The trading dashboard provides and overview of both the spread position and physical supply to and from the crushing plant. The dashboard allows the trader to analyze his position and monitor his (personal) alerts on the dashboard. Based on the available information, the trader can act by selecting one of the modules to trade either physical or financial instruments. On the left of its screen the trader immediately sees the action that needs to be taken based on pre-defined thresholds like contracts that need approval or contracts with a specific size that are not fulfilled yet.
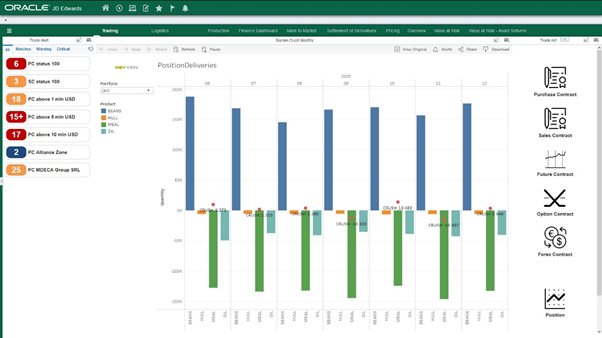
The long position reflects the inflow of beans (purchase) and the short position reflects the number of refined products that are produced at the crushing plant. Based on the available raw materials and the sales position for the specific month, the dashboard calculates the short position on crush. With this analysis on crush spread, the trader can further determine its right course of action and determine what trades need to be made in order to optimise the crush spread.
Logistics
The logistics dashboard is focussed on purchasing the raw materials from the trading company and supply to the crushing plant.
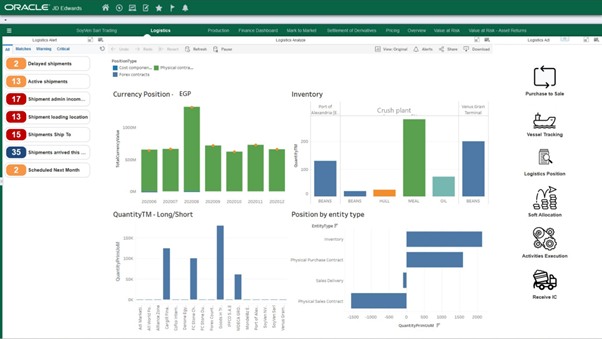
Logistics monitors the shipments coming in to create an inventory and manufacturing planning. Raw materials are stored in the in harbor and silos. At the plant site, a minimum amount of raw materials is stored to supply the daily crushing. Refined products are also stored and ready for shipment inland or international sales. Based on KPI’s on incoming shipments per counterparty and sales volumes logistics can manage their physical supply and currency implications. On the left of the screen, the logistical employee sees alerts like shipments which need to be confirmed or where a status is passed due. In the middle the long and short position and inventory positions can be seen. This allows a logistical employee to take immediate action and oversee its overall position. On the right he Is directed immediately to the relevant applications on vessel tracking, logistical position and activities execution.
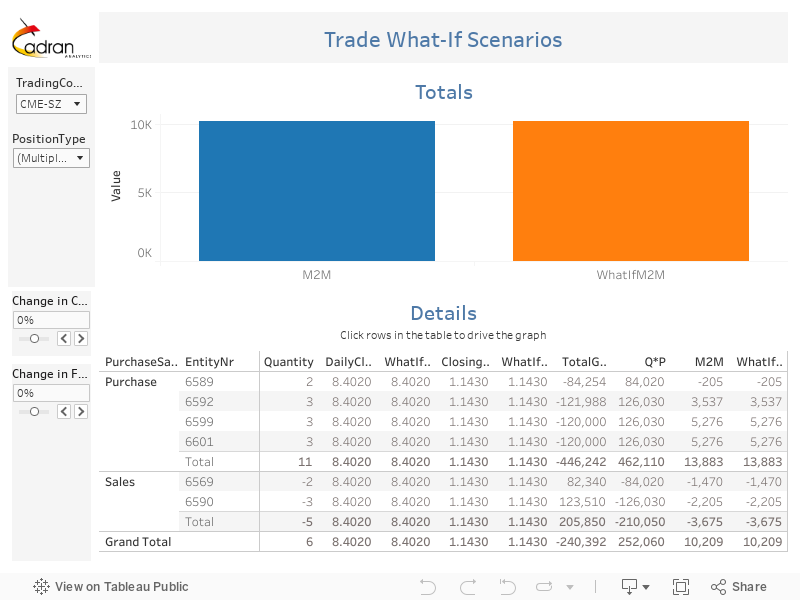
What-If analysis
In order to determine where market risk and spread risk, the trader can use the “What If” analysis functionality. This makes use of the data provided by Arantys, while providing advanced abilities to apply different scenarios. These insights can be used immediately to take action on.
The trader can select different commodities or instruments or even portfolio’s to do his analysis. The trader can select the relevant market variables to manipulate and see the effects on the M2M of his portfolio. By doing so, the trader can assess his risk for both the production portfolio as his prop portfolio.
Interested in your Arantys use case?
By combining the existing trading, logistics, manufacturing, and finance functionality, Arantys provides an excellent solution for your crush spread trading. As provided in this use case, the combination fo JD Edwards, Arantys and Tableau allows for multiple applications in the commodity trading sphere. This use case shows a limited application, that can be extended in multiple directions. As showed in this example, the use of an integrated system allows for an extensive integration and better insights that allow for immediate optimisation of business decisions. Interested in what Arantys and Tableau can do for your use case? We gladly discuss your use case and discuss how Arantys can be applied to your commodity or business application.

Author: Arjan Meijdam
Consultant Commodity Trading & Risk Management