
5 common advanced analytics scenarios & resources for Tableau
The term “advanced analytics” refers to “techniques and tools typically beyond those of traditional business intelligence,” often associated with data science (Gartner). Tableau invests in advanced analytics so that you can get to the root of your questions, no matter how complex they become. Tableau uses this picture:
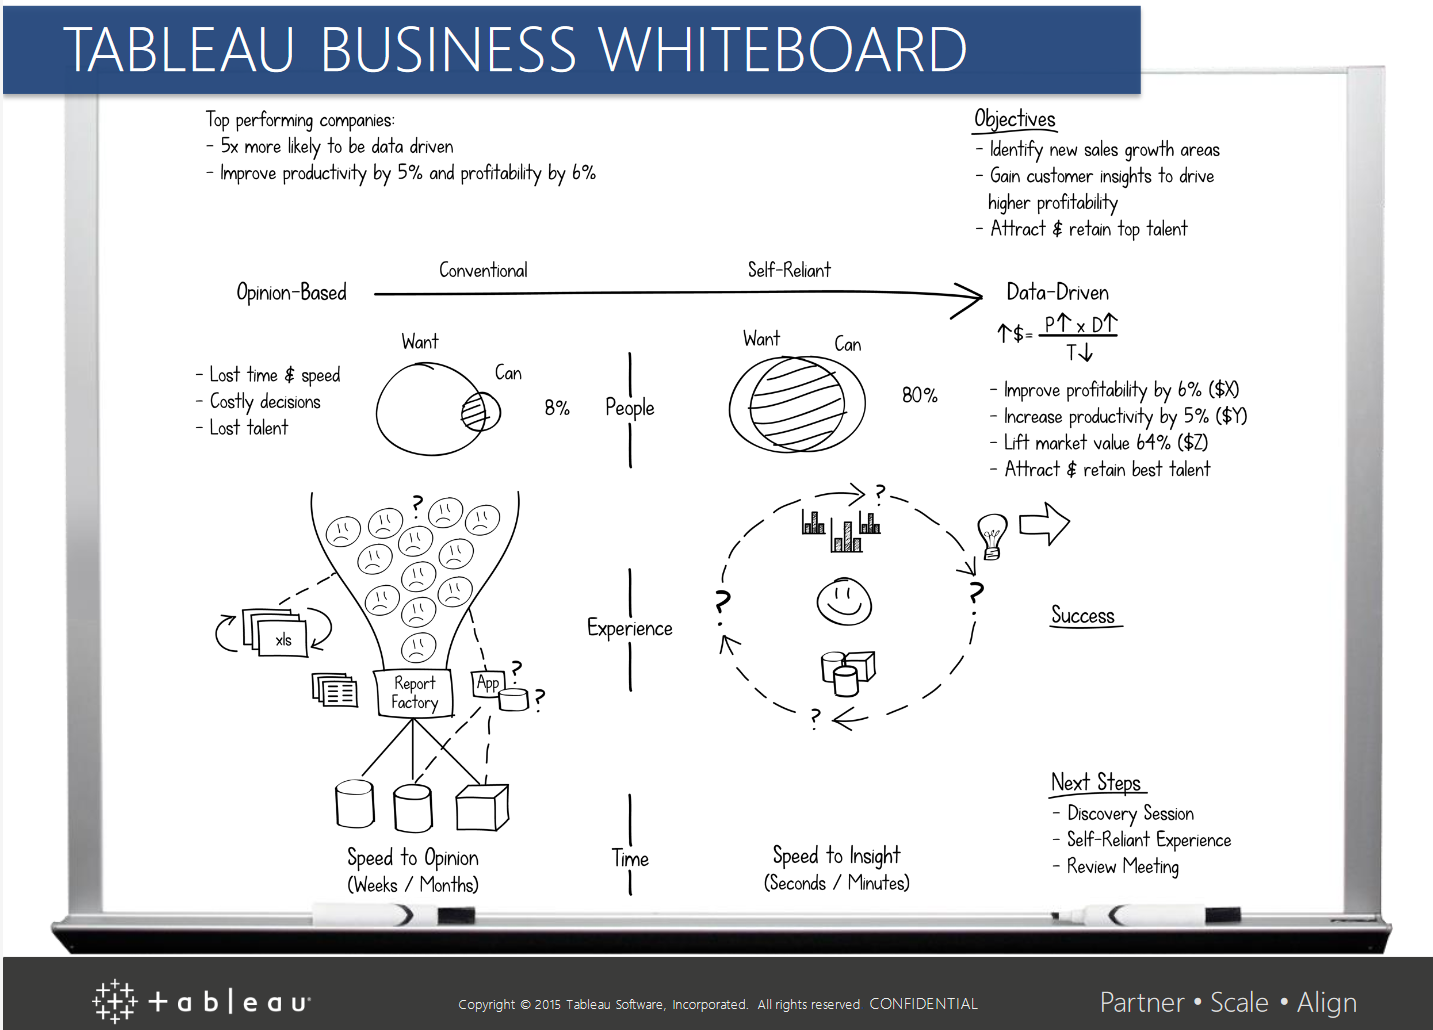
It shows that conventional means give a ratio of 8% between people who want information and people who can provide this information need. Tableau tries to increase this ratio to 80%, making an organization much more self-reliant and less dependent on IT employees with specialist skills.
The goal is to give non-technical users, who are data analysts, access to advanced statistical capabilities and analysis to draw in-depth smart and process-improving conclusions. This makes Tableau a very important player in the field of self-service bi.
Tableau revamped their whitepaper, Advanced Analytics with Tableau, which explores how Tableau’s advanced analytics features help you address common analytical challenges, showcasing real-world examples of predictive analytics, segmentation, what-if analysis, and more.
In this post, we’ll talk about Tableau’s approach to the scenarios analysts and data scientists work with every day, and provide you with resources to conduct sophisticated data analysis.
Segmentation and cohort analysis
Tableau promotes an investigative flow for rapid and flexible cohort analysis. Move through different perspectives quickly by slicing and dicing the data along as many dimensions as you want. Automated clustering—a machine learning technique—also helps improve your segments. This is often useful for spotting difficult-to-see patterns in data sets with high dimensionality.

Quickly segment and categorize data and perform powerful cohort analysis with relative ease. These capabilities also help data scientists investigate initial hypotheses and test scenarios.
Scenario and what-if analysis
By combining Tableau’s flexible front-end with powerful input capabilities, you can quickly modify calculations and test different scenarios. With sets, groups, drag-and-drop segmentation, and parameters, Tableau makes it possible to move from theories and questions to a professional-looking dashboard that allows even non-experts to ask questions and test their own scenarios.
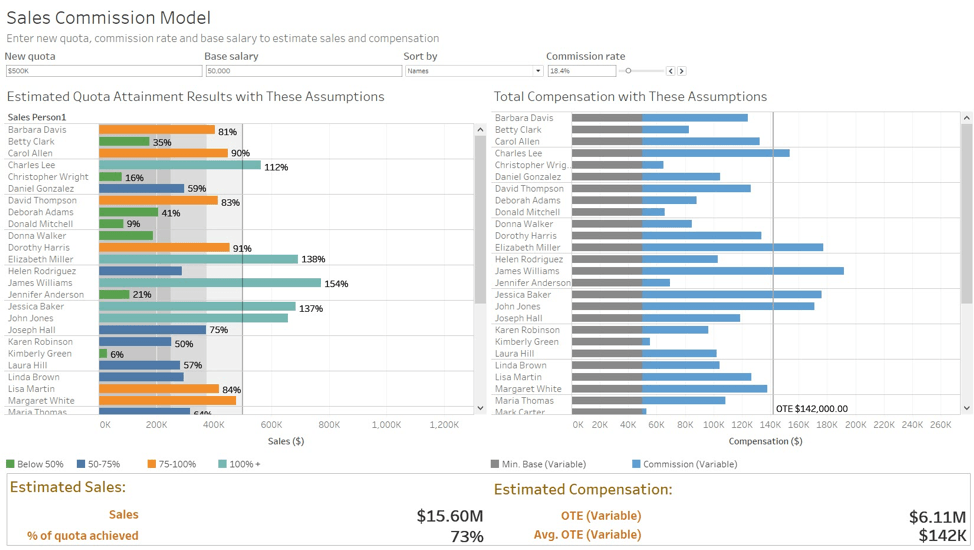
Streamlining what-if analysis empowers you to focus on the more complex aspects of your analysis and deliver greater insights. At the same time, it’s easy to create intuitive visuals that help anyone engage with data.
Sophisticated calculations and statistical functions
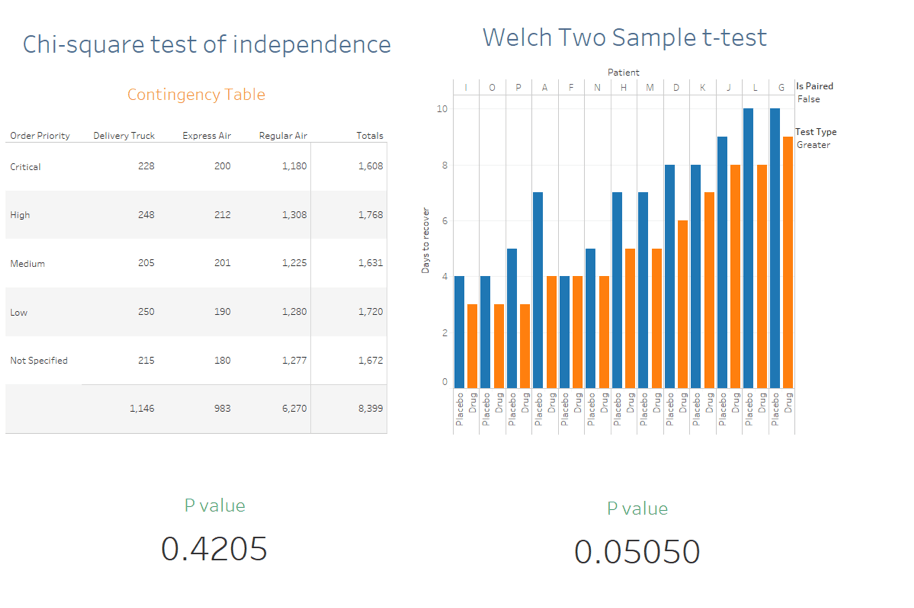
Tableau possesses a robust calculation language, making it easy to augment your analysis with arbitrary calculations and perform complex data manipulations with concise expressions. In conjunction with the Summary Card feature, Tableau gives you built-in options—from nesting basic aggregations to statistical calculations like standard deviation, mode, kurtosis, skewness, correlation, and covariance.
With Tableau Table Calculations, challenging database work—such as manipulating aggregated data, creating complex lags, and building data structure-dependent aggregations—requires just a few clicks or a simple expression. This both empowers non-technical users and saves experts countless hours and laborious SQL code.
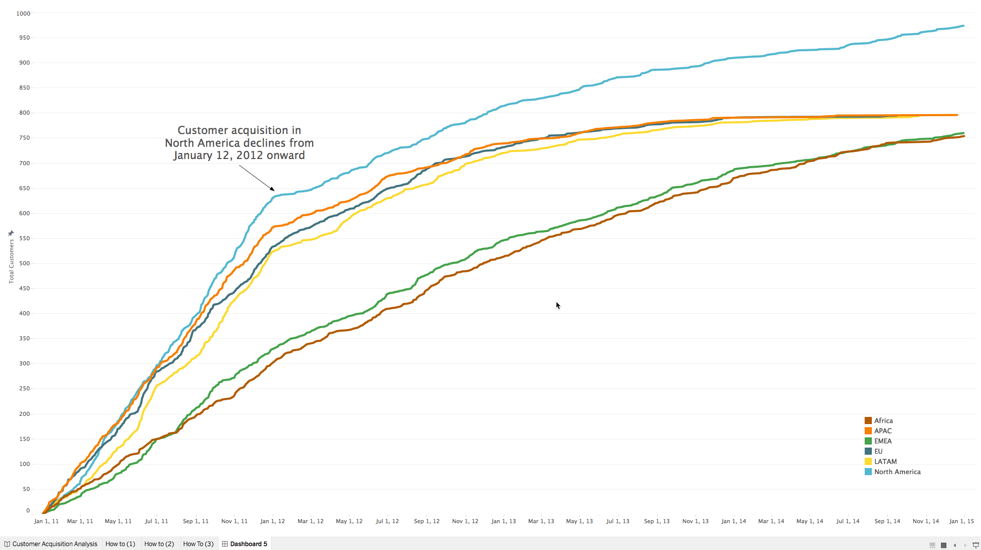
Time-series and predictive analysis
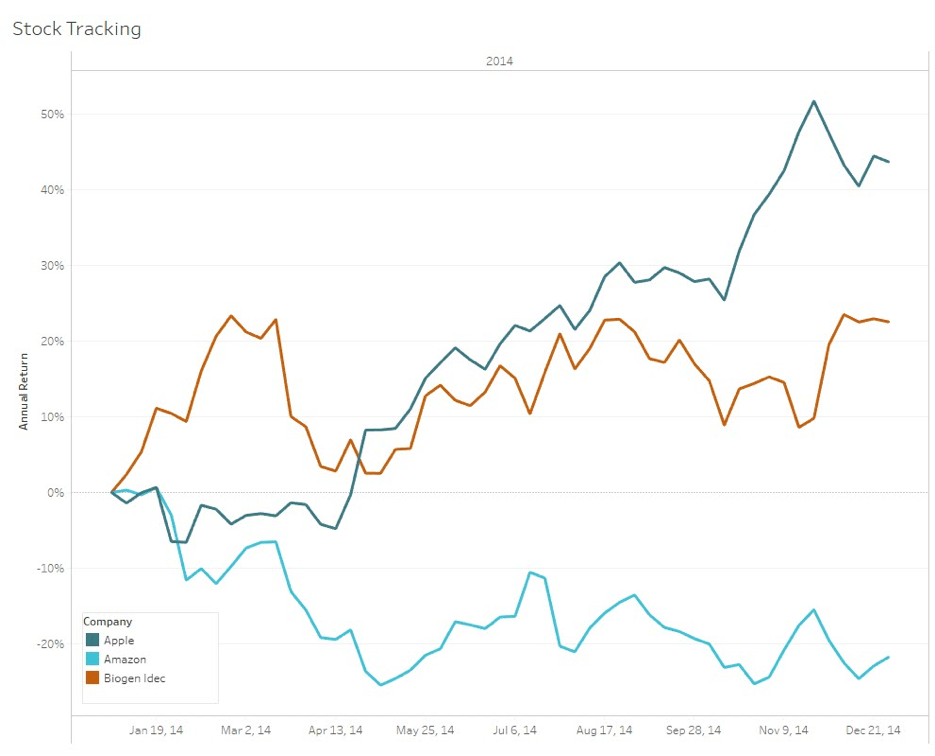
Tableau natively supports rich time-series analysis, meaning you can explore seasonality, trends, sample your data, run predictive analyses like forecasting, and perform other common time-series operations within a robust UI.
Easy predictive analytics adds tremendous value to almost any data project. By supporting both complex configuration and simple interactive modeling, Tableau serves both the data scientist and the end user.
Check out these feature resources for your time-series and predictive analysis:
- Time-Series
- Forecasting
External services integration
R, Python, and MATLAB integrations combine the power and ease of use of Tableau’s front-end with the statistical power of other platforms so you can handle nuanced machine learning workflows.
The combination of Tableau with Python, R, and MATLAB allow you to express the results of complex modeling as beautiful and engaging visuals for consumption. People of all skill levels can ask what-if questions and evaluate hypothetical scenarios by interacting with controls embedded into the dashboards.
Learn more about advanced analytics in Tableau
In many ways, Tableau stands alone among analytics platforms. We design Tableau with both the business user and the data scientist in mind. By staying focused on our mission to empower people to ask interesting questions of their data as quickly as possible, the Tableau platform delivers valuable functionality for everyone.
Download whitepaper Advanced Analytics with Tableau
Source: Tracy Rodgers, Product Marketing Manager Tableau