BI – Into the fifth dimension
Oracle BI – Thoughts (2) – Cadran publishes a series of articles about the ideas surrounding Oracle Business Intelligence in combination with Oracle JD Edwards. In these articles various considerations and reflections are discussed, which can be helpful in making the right decisions in the implementation and application of both systems. This second article discusses the star scheme.
Star scheme
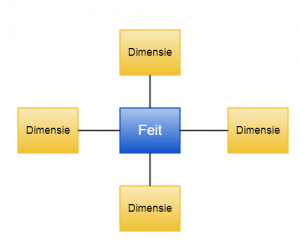
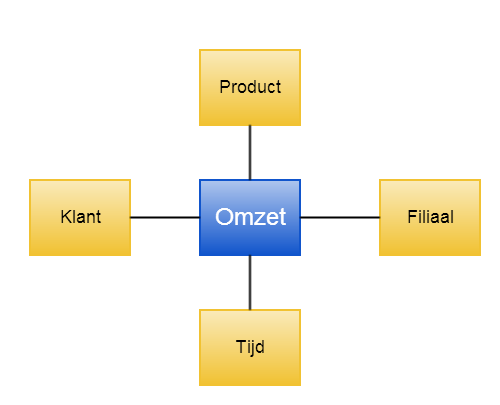
Ralph Kimball talks about dimensional modeling. His theories and scientific treatises date from a long time before the time of business intelligence software solutions. His philosophy however has been the cradle of what constitutes the star scheme in the physical and logical layer of Oracle BI. The star scheme is the visual representation of the facts or measures and their relation to the relevant dimensions.
In an abstract sense:
Star Schedule Conrete
Fact
A fact is for example Revenue. Multiple facts, which are directly aligned with each other at the same level, can be recognized when it concerns, for example Revenue with corresponding Quantities and Cost of Goods Sold. A fact will always have a form of aggregation enabling grouping of this data. This can be a count (eg Number of Invoices) or a summation (eg Sales Amount). A fact is not just a KPI (Key Performance Indicator). This is only the case when valued (good or bad) or when a goal, standard or budget is included.
The added value of a fact within Oracle BI is only obtained when a fact of an unambiguous business definition is provided, which is linked to the implementation issues within Oracle JD Edwards. What is Revenue? Revenue could be defined as the total of all amounts invoiced. Immediately this raises questions:
- What is the amount (eg Which currency is involved)?
- What is invoiced (eg invoice date filled or only after posting the sales update)?
- Which date is used here (eg Invoice or correct Ledger date)?
Then more detailed questions rise, such as:
- How should credit orders be seen in this?
- Which order types apply?
- Which status codes or hold codes may affect this?
- How should internal (intercompany orders) versus external sales be handled?
- How should (payment) discounts be handled?
Only when these and other detailed questions are answered and a common consensus exists, the fact Revenue in Oracle BI can play a meaningful role. These definitions must be well documented and preferably must be recognizable and retrievable within Oracle BI.
Dimension
A dimension can be recognized for every time the word “Per” is mentioned with a fact:
- What is the Revenue per Customer?
- What is the Revenue per Month?
A dimension will also have to be well defined. What is a Customer exactly and how can it be recognized? Is that every person who has ever appeared in the Accounts Payable Administration, or is this someone who has the search type C in the address book?
The information, which can be related to a fact or to a dimension, is called Attributes. With a fact such as Revenue, the invoice number can be considered at the lowest level of detail. For a dimension such as Customer, the Country would be an attribute of that customer. In Oracle BI Attributes will behave as dimensions. It is important to define attributes as well. What exactly is Country? Is that, for example, land of the physical location?
This eventually results in a business information model (or Common Enterprise Information Model, as Oracle calls it) that can be provided in One Version of the Truth. The following article in this series discusses the interplay between facts and dimensions.
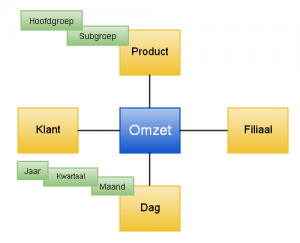
Hierarchy
When a dimension also has a structure, we can call it a hierarchy.
An example is the dimension Product, which may be divided into main groups and subgroups. In Oracle JD Edwards this format will probably be set in Category Codes. The meaning and interpretation of this now becomes essential. Another well-known example is the dimension Time, which has the obvious calendar structure. This provides Oracle BI with various options in the areas of Drill Down, Roll Up, Zoom In, Zoom Out, but also of display options and aggregation levels.
In my next article, the interplay between facts and dimensions will be explained further by examples.
The implementation of a BI solution is more than the implementation of a software solution. Cadran’s vision is focused on determining the right information that is available to the right people in your organization at the right time. A thorough project approach is very important to prevent the pitfalls of such an implementation. BI is not about developing reports or creating nice dashboards. BI is about managing your organization and Cadran is your partner when it comes to Business Intelligence and JD Edwards. Do you want to know more?
Author: Rick Brobbel
BI Consultant at Cadran Consultancy


