Creating insight into the effect of price volatility in the coffee market
Price Volatility in the Coffee Market
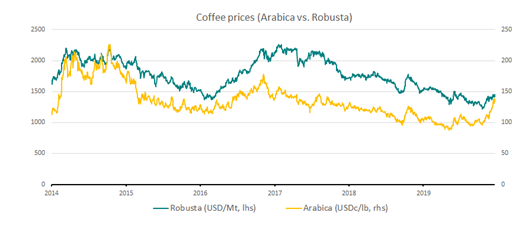
Visibility of price volatility in coffee trading is key. Volatility can be caused by either the demand or supply side. An adverse supply shock can cause market prices to rise, especially when demand elasticity is low. Where a rising market demand – in combination with a low supply elasticity – can cause price spikes. Some examples of demand factors: growing demand in nations as income rises (e.g. China), substitutes (e.g. tea), or inelastic demand among coffee consumers because of brand loyalty. Supply factors that can affect the price volatility are for example climate conditions like El Nino or disruption in distribution.
According to the ICO[1] in May: “a joint supply and demand shock with varying effects overtime” is causing significant price volatility the past few months and this is also notified by the IFPRI’s[2] Food Security Portal were the price volatility from coffee C Arabica is indicated as ‘excessive volatility’. A very volatile price of a good, can have significant impact if a trader has taken a position in this good. The risk taken can either reap significant rewards, but could also create excessive costs.
[1] “Volatility coffee prices: Covid-19 and market fundamentals, ICO / IFPRI, May 2020”[2] IFPRI: International Food Policy Research Institute


Vox recently investigated how climate change impacted the coffee production in Colombia. Quiet insightful from a volatility perspective. It can be expected that climate change exacerbates price volatility.
Marking your position to the Market
This underlines the importance of visibility in price risk for trading companies and therefore Cadran developed Mark to Market functionality to support this. The development of this form of risk management started with one of our clients – a coffee trader – almost ten years ago. Multiple aspects like country of origin, incoterms, and quality define the value of a good. After all Arabica of Robusta with origin Vietnam or Indonesia can be valued differently. Also, transportation and storage conditions can influence the quality of the coffee bean, and also that part of the value chain can influence the valuation. Either on a contract level or on specific characteristics (see Use case: Characteristics vs Items – Using the Soy Market as an example for an extended explanation of characteristics) price rules can be created. Throughout the value chain, additional pricing can be entered. Since the volatility of the good is often not within the realm of influence of the trader but is based on market conditions, the valuation to the market remains critical. Based on predefined rules it is possible to evaluate multiple (physical or financial) deals at once. If needed, a trader can correct individual deals by creating a markup/down. This in order to support the coffee trader in a market where price volatility, as the world market of coffee is, to keep track of the price risks.
Mark 2 Market Functionality
With the now supported Mark to Market functionality, the valuation can be determined on additional details from the physical or financial deal and this can result in a markup/down. Or excluding logistic cost by working with the contract or base price for a physical deal. Creating valuation based on delivery moments where daily market prices are used is the starting point for the Mark to Market calculation. Daily market prices can be received through interfaces with brokers like Bloomberg or Reuters. In the case of future options, Greeks calculations based on the Black Scholes model are part of the Mark to Market functionality for options.
This all gives the coffee trader more functionality to monitor and control the trading process.

Going beyond the Transactional
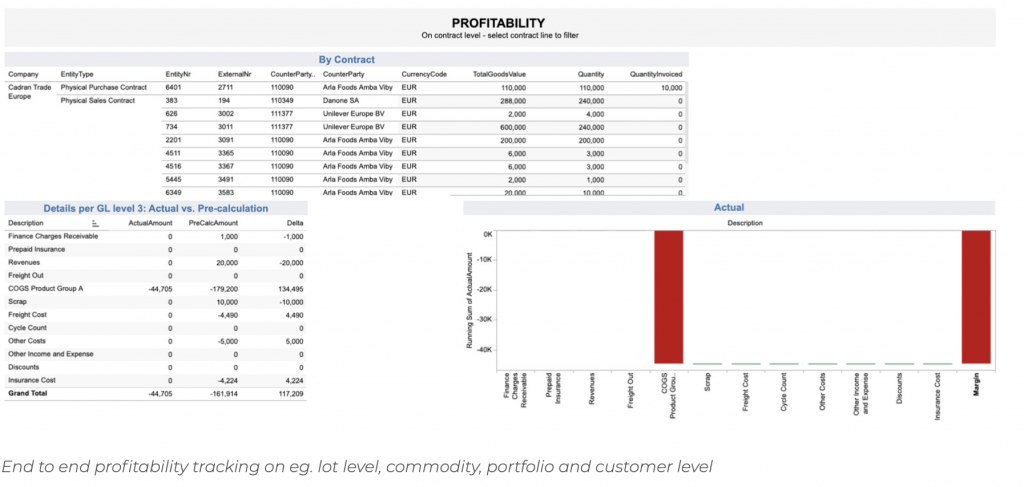
As the transactional layer is herewith both flexible but also uniformly available, extended analysis can be performed like what if analysis (see the blog What-If-Analytics on Trade in Tableau) and extended profitability analysis like displayed below. The effects of price volatility can be easily tracked on both an individual contract and portfolio level, this is visible in the report below. Lastly, we can use the mark to market calculation to build a Value at Risk calculation as described by our colleagues in their blog Value at Risk for Commodity Trading, using Tableau and R.

Need insights in your trade in the global commodity market?
Interested in how we could help you in your trade in the global commodity market or interested on how this would apply to your use case? Contact us!
Author: Toin van Westing
Consultant at Cadran Consultancy


